Dashboard overview
The dashboard gathers the most useful live metrics from the toolkit in one compact panel. It can be hidden or placed at the top right, bottom right or bottom left, with Tiny, Small, Normal and Large size options.
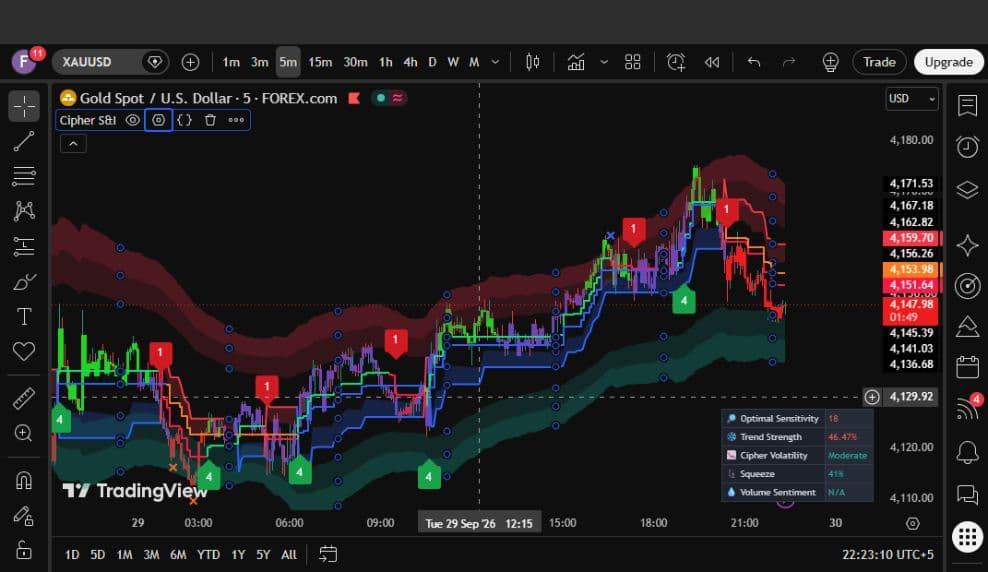
Dashboard metrics
| Metric | What it communicates |
|---|---|
| Optimal Sensitivity | A grid-search estimate based on recent bars for the selected signal engine. |
| Trend Strength | The current strength of directional price movement. |
| Cipher Volatility | A plain-language reading of current market volatility. |
| Squeeze | Compression conditions that may precede expansion. |
| Volume Sentiment | Directional volume context when valid volume data is available. |
Dashboard metrics describe current conditions and recent optimization. They are not forecasts and are not guarantees of future performance.